 DigiUsher Documentation
Kubernetes
Find the Kubernetes nodes and workload requests that you pay for and do not need, and see how your cluster cost divides across namespaces, workloads, and nodes.
The Kubernetes view shows where your cluster cost goes and how much of it you can recover. It finds the nodes that your node pools do not need, and the workload requests that are larger than the usage. Open the view from Lenses > Kubernetes in the left sidebar.
Use Kubernetes when you need to:
- Find the node cost that goes away when you cut workload requests.
- Get the exact CPU and memory requests to apply, as YAML or
kubectlcommands. - Find the workloads with requests that are too small for their usage.
- See how the CPU, memory, GPU, storage, and network costs divide across your clusters.
The view has two tabs: Rightsizing and Costs. The view opens on Rightsizing. To save the filters of a tab and open them again later, use the Perspectives button in the page header.
Rightsizing
The Rightsizing tab recommends a CPU request and a memory request for each workload. It also shows how many nodes each node pool needs at those requests. The tab has two views: Node pools and Workloads. The view opens on Node pools.
The tab shows two savings figures:
- Recoverable is the node cost per month that goes away when the node pools remove the nodes that they do not need.
- Allocated cost freed is the cost per month that the request cuts take off the workloads. Your bill does not drop until nodes go away.
The Node pools view shows the node cost of your clusters and the part of it that you can recover. You can filter this view by Cluster only, because one node pool holds the pods of many workloads.
The Node cost per month card gives the node cost now and the recoverable cost per month. Under the figures, it tells you how many nodes you can remove. A bar divides the node cost into Stays and Recoverable. If workloads need a request change, a line gives their number and a link to the Workloads view.
| Column | Description |
|---|---|
| Node pool | The node pool name. Nodes without a node pool label show as No node pool label. |
| Binds | CPU or memory, whichever runs out first on these nodes at the recommended requests. Only a cut in this resource can lower the node count. |
| Nodes | The node count now → the node count needed at the recommended requests. |
| Requested | The pod requests for the Binds resource, as a share of the node capacity today. |
| Unrequested / mo | The node cost per month for capacity that no pod requests or uses. |
| Recoverable / mo | The node cost per month that goes away when this node pool removes the nodes that it does not need. |
Click a node pool row to expand it. The expanded row shows:
- A CPU bar and a memory bar, with the capacity now and the capacity needed.
- An instance type to move to, with the monthly saving, when DigiUsher finds one.
- The workloads in the node pool, with a link that opens them in the Workloads view.
Confidence
The confidence label tells you how much usage history the recommendation has.
| Label | Meaning |
|---|---|
| Established | The recommendation has the full usage history. |
| Provisional | The recommendation has less than the full history. The badge shows the days of data, for example 5 of 8 days. Apply it with care. |
| Insufficient data | The workload has less than 3 days of data. It gets no recommendation. |
Workload details
Click a workload row to open its details panel. The panel shows:
- The confidence label and the dates of the usage data.
- The Recoverable and Allocated cost freed figures.
- The node pools of the workload, with the binding resource, the freed capacity, and the recoverable cost of each.
- The Horizontal Pod Autoscaler settings, if an HPA scales the workload.
- Containers, with one section for each container. Each section gives the current and recommended requests and limits, with charts of the CPU and memory usage.
- Recommended resources, with the values as YAML and as
kubectlcommands. Click the copy button to copy them.
A Job cannot change after it starts. For a Job, the panel gives the YAML only. Put these values in the template that creates the Job.
The bottom of the panel shows the status of the recommendation and an Open in Recommendations link. If you are an administrator, you can also click Mark as applied, Dismiss, Snooze, or Reopen. For more about recommendation statuses, see Savings.
Costs
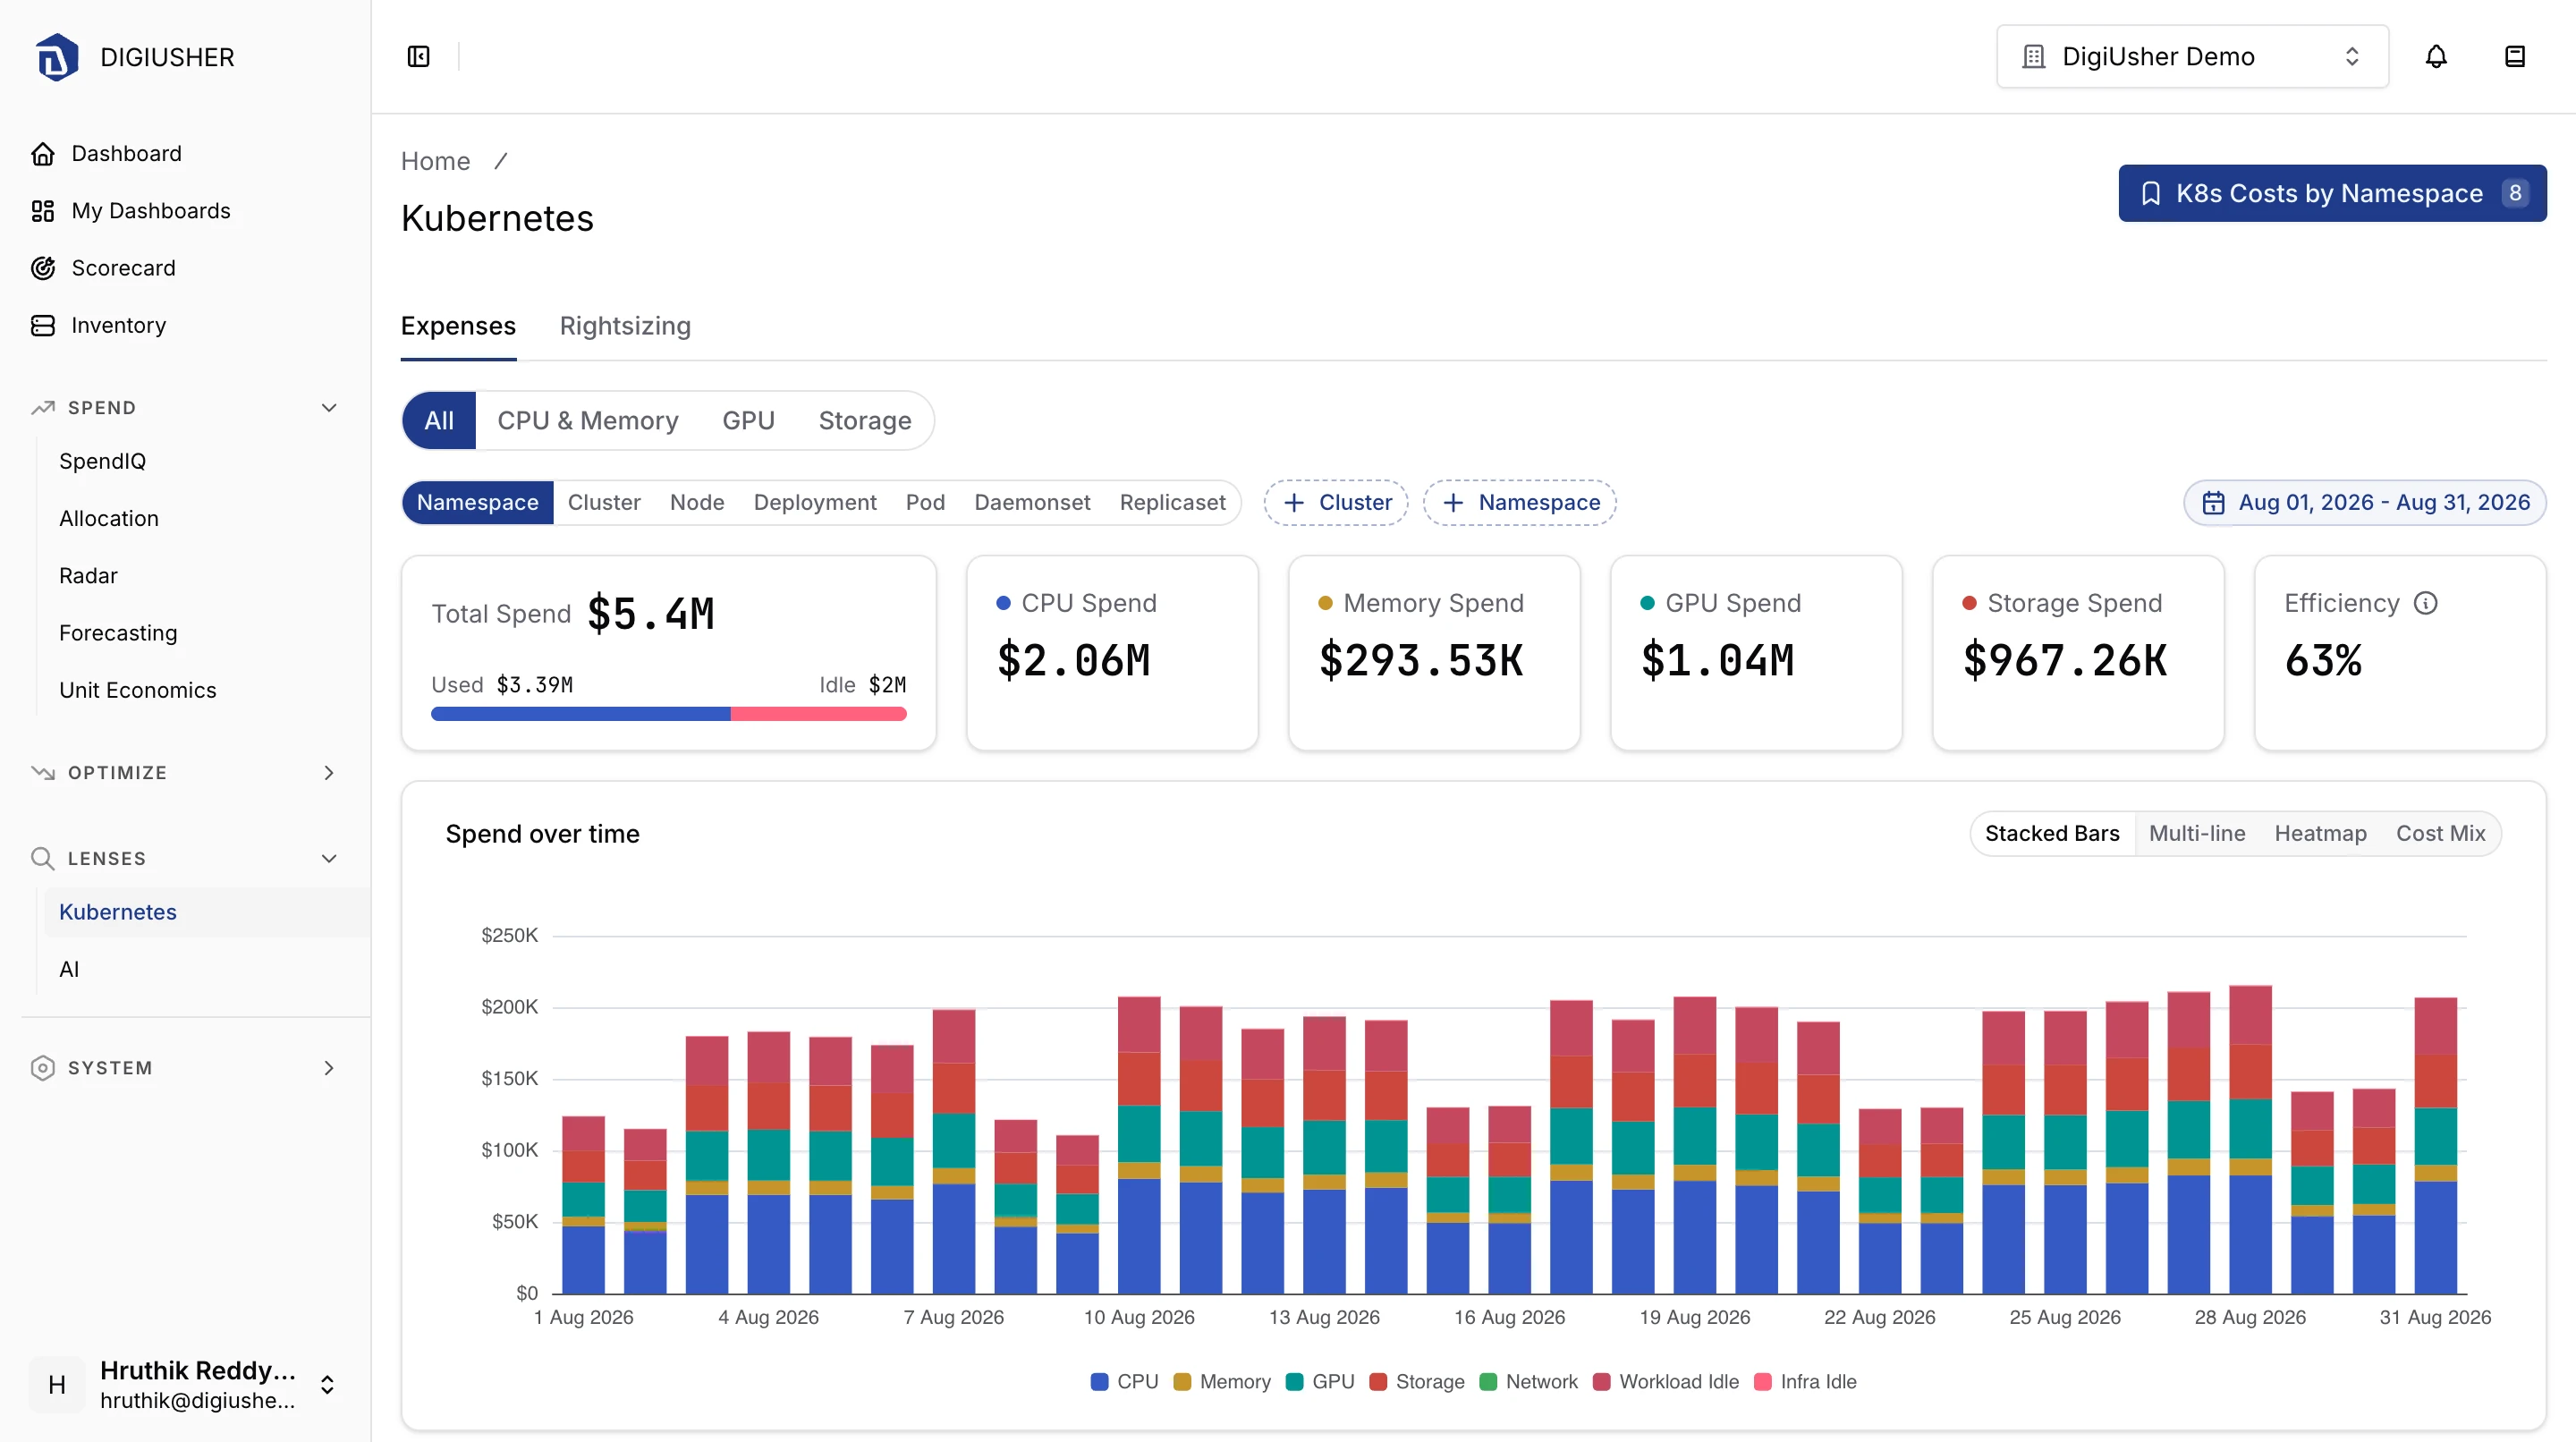
The Costs tab shows how the Kubernetes costs divide across your clusters, and which part of the cost is idle. Use the date range picker to set the period.
Lenses
Select a lens at the top of the tab:
- All gives the total cost, split by resource: CPU, Memory, GPU, Storage, and Network.
- CPU & Memory splits the CPU cost and the memory cost into used and idle parts. Use the CPU + memory, CPU, and Memory control to select the resource for the chart and the table.
- GPU gives the GPU spend, the idle GPU cost, the GPU-hours, and how busy the GPUs are. The GPU breakdown table gives the GPU type, GPU count, and idle cost of each group.
- Storage gives the storage spend, the used share of provisioned storage, and the volumes that no claim binds. It compares provisioned and used storage over time.
The All and CPU & Memory lenses show these figures:
- Total cost gives the cost of the selected period.
- Idle gives the idle cost and its share of the total.
- Recoverable / month gives the node cost that you can recover. Click the card to open the Rightsizing tab.
DigiUsher divides the idle cost into two parts:
- Unused requests is the cost of capacity that pods request but do not use.
- Unrequested capacity is the cost of node capacity that no pod requests.
Group By
Use the Group By control to change how the chart and the table aggregate the costs.
| Lens | Dimensions |
|---|---|
| All, CPU & Memory, GPU | Namespace (default), Cluster, Node, Deployment, Pod, DaemonSet, ReplicaSet |
| Storage | Namespace, Cluster, PVC (default) |
You can also filter by Cluster and Namespace. The Storage lens adds a StorageClass filter.
Cost table
The table groups the rows by cluster. Its columns depend on the lens.
To download the current view for an external analysis, click Export CSV above the table.
Enabling EC2 Memory Metrics for Accurate Rightsizing
Install the CloudWatch agent so DigiUsher can read EC2 memory utilization, and make sure that the read-only IAM role of DigiUsher can read those metrics. Without memory data, the rightsizing recommendations use only CPU, network, and disk, and they can propose a smaller instance than a memory-aware analysis supports.
Inventory
Browse every discovered cloud resource with month-to-date cost, ownership tags, waste flags, and utilization metrics in one searchable table.