 DigiUsher Documentation
Unit Economics
Divide cost by a business metric to track cost per active user, per request, or per GB.
Unit Economics gives the spend as a cost for one unit of business value: the cost for one active user, for one transaction, or for one GB of storage. Open it from Spend > Unit Economics in the left sidebar.
Use Unit Economics when you need to:
- Show that spend with a growth of 20% and usage with a growth of 40% is an efficiency gain, and not overspend.
- Track the cost for one unit of one product line, and not of the whole organization.
- Divide the cost for one unit by customer, team, region, or another dimension of your metric.
- Give finance and engineering the same efficiency number.
A formula is a cost divided by a business metric: cost(pools, view) ÷ North Star Metric. DigiUsher computes it for each day, week, or month.
Before you start
The page reports the formulas. An organization without a formula therefore sees No Formulas and a Create Formula button in place of a report.
For a formula you need two things:
- A North Star Metric, which is the business quantity that you divide by. First register the metric, then upload its values.
- A formula, which gives the cost to divide, the metric to divide by, and the computation frequency.
Mappings are optional. You need them only for a cost per unit that is divided by a dimension.
You reach all three from the page action bar: Formulas, Mappings, and North Star Metrics.
Reading the report
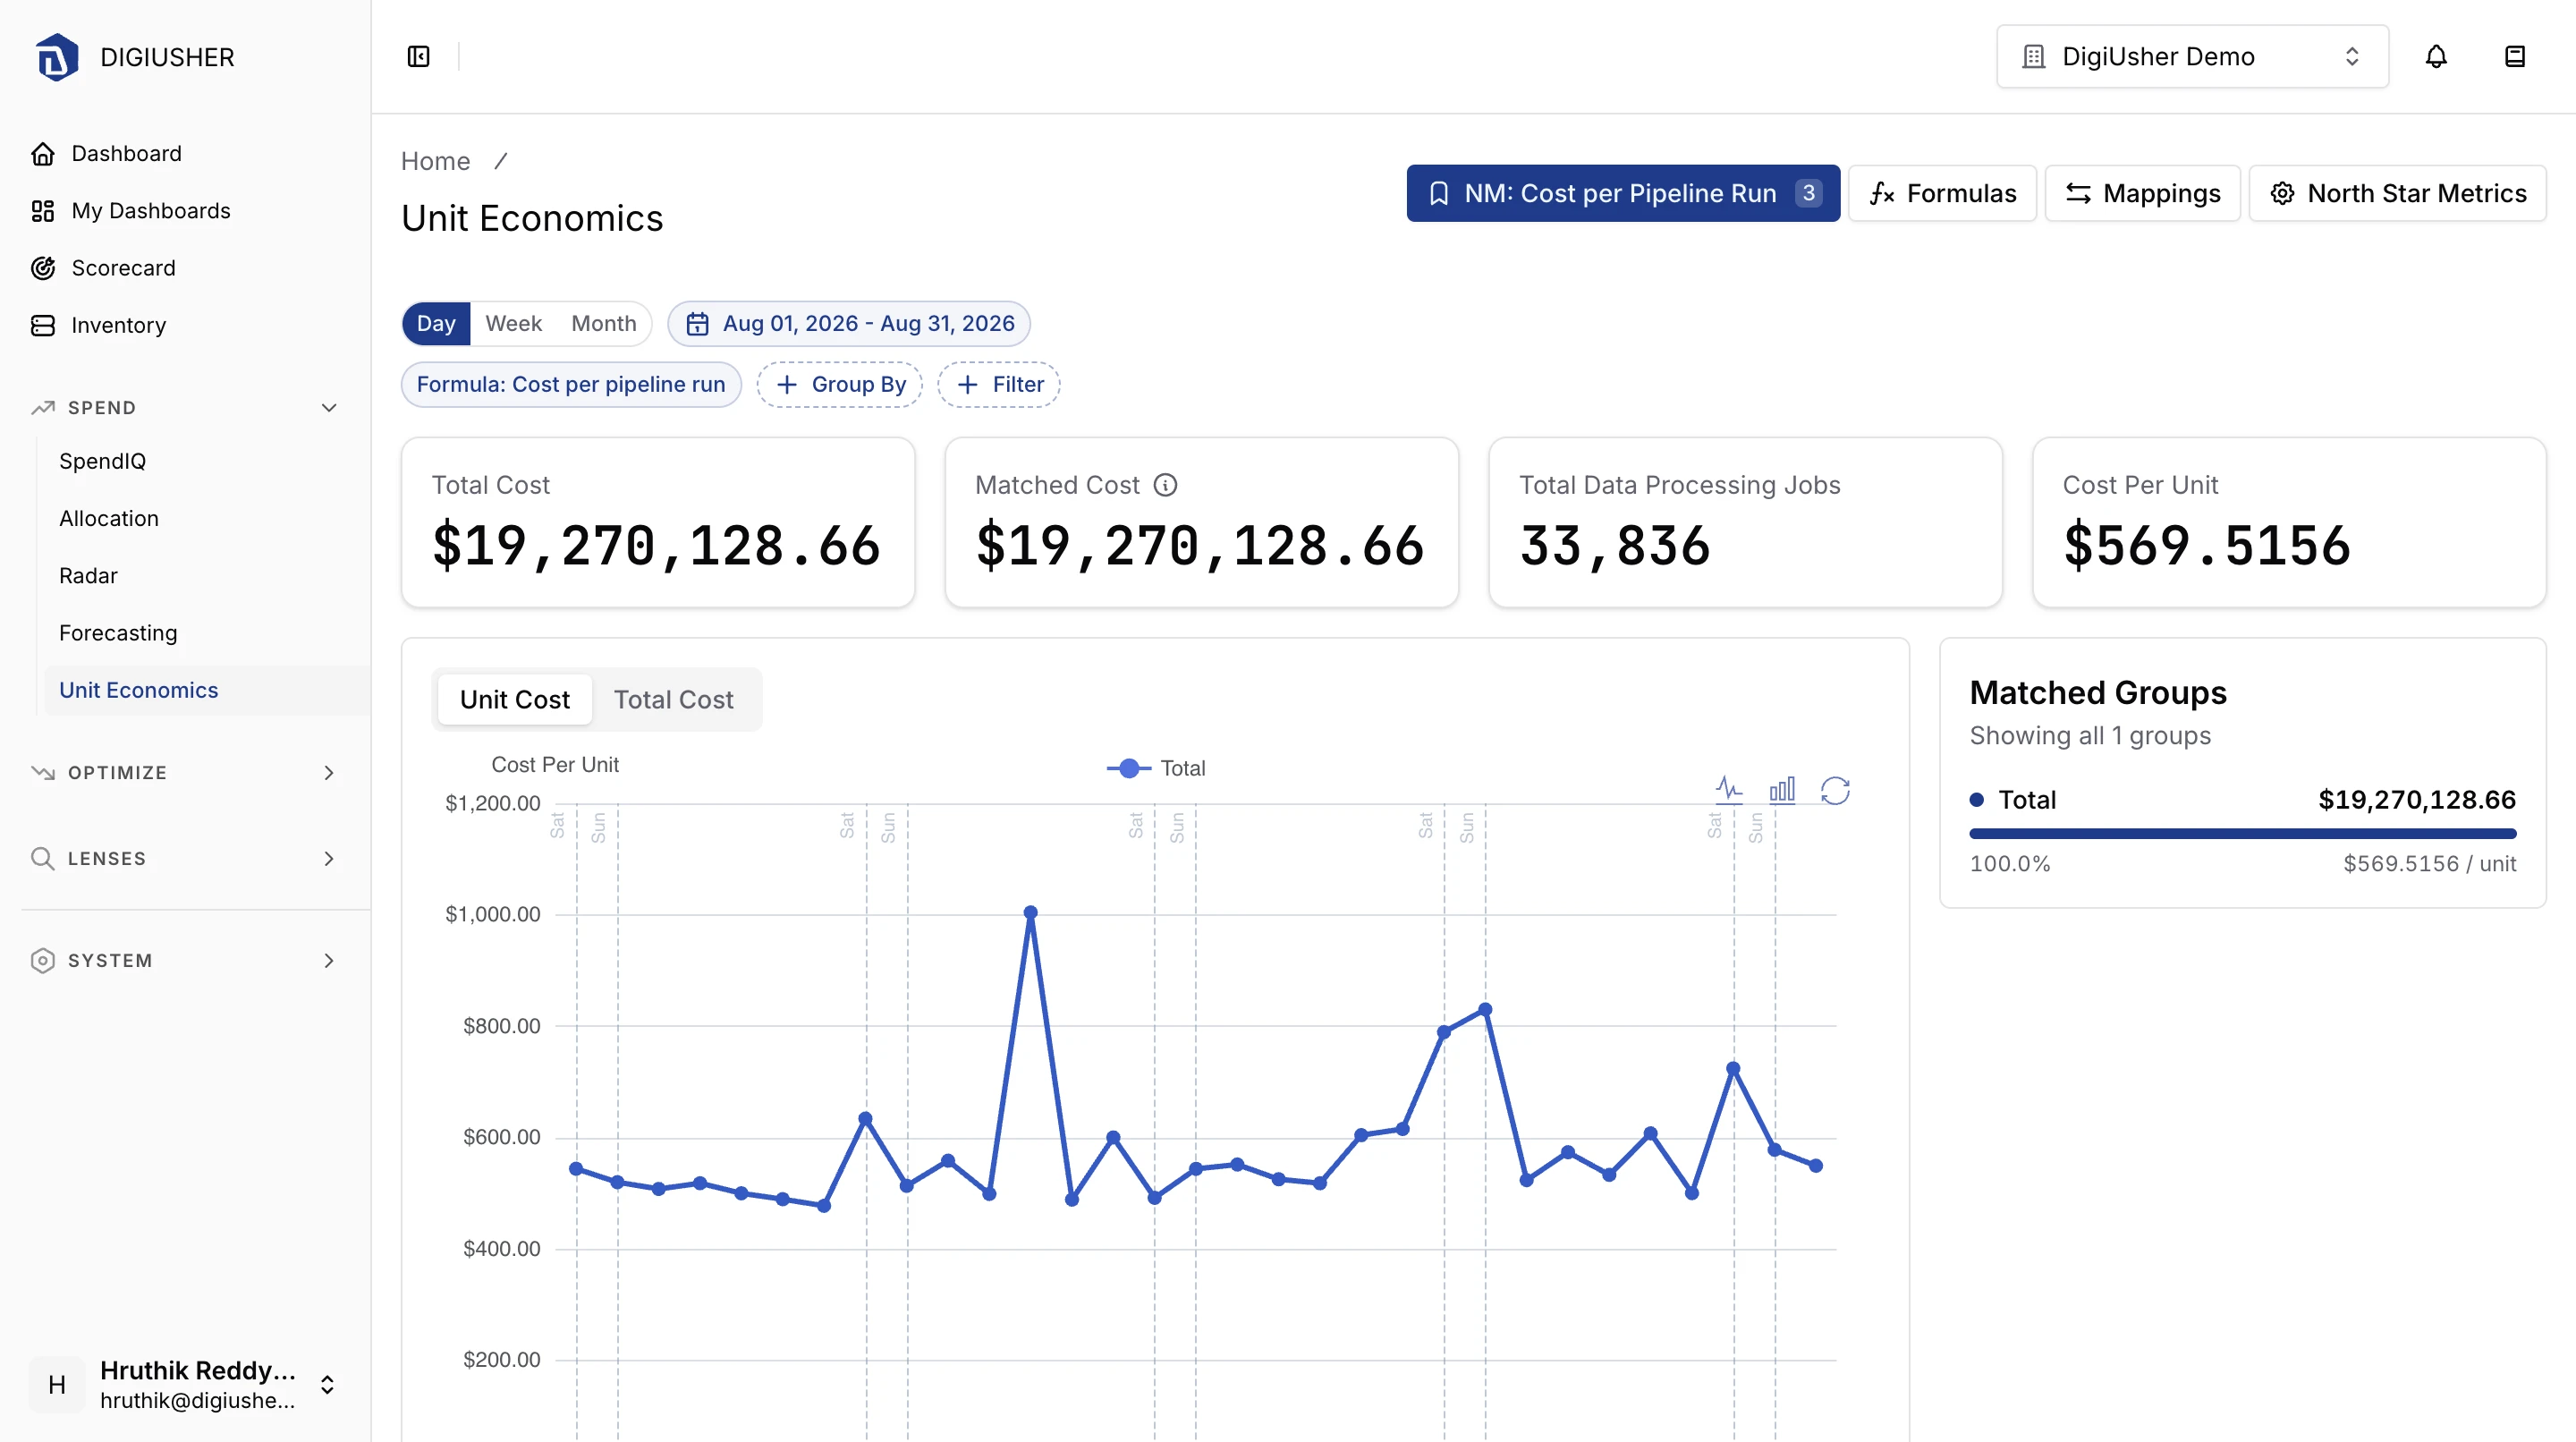
Filters
| Filter | Description |
|---|---|
| Granularity | Day, Week, or Month. The list gives only the granularities that are equal to or wider than the base granularity of the formula. |
| Date range | The period to report, with presets such as This month and Last quarter. |
| Formula | The formula to report. Each option gives the formula name and its base granularity. |
| Group By | Divides the report by one dimension of the metric. None gives one number for each period. |
| Filter | Limits the report to the selected values of a dimension. |
Group By gives the dimensions of the North Star Metric of the formula. It does not give a dimension that a mapping of the formula already covers. To filter on a dimension without a mapping, Group By must have that dimension. The page sets it for you.
Summary
- Total Cost gives all cost in the scope of the formula and the period.
- Matched Cost gives the part of that cost that the mappings of the formula paired with a metric value. It also gives the number of matched groups.
- Total (metric name) gives the total metric value of the period.
- Cost Per Unit gives the matched cost divided by the metric value. When the period has no metric value, it gives N/A (no NSM data).
Total Cost minus Matched Cost is the cost that reached no metric group. A large difference means that a mapping has values missing. It does not mean that the cost is untracked. Read the Unmapped row in the table.
Charts
The chart has two tabs. Unit Cost plots the cost for one unit over time. Total Cost plots the spend behind it. Read the two tabs together. A falling unit cost with a rising total cost is the usual sign of healthy growth.
Group Breakdown
| Column | Description |
|---|---|
| Date | The period, in the selected granularity |
| Group | The metric group, or Unmapped for cost that paired with no group |
| Cost | Cost attributed to the group |
| NSM Value | The metric value of the group and the period |
| Cost Per Unit | The cost divided by the metric value, or N/A when the metric value is absent or zero |
Open a row to see its breakdown by the selected Group By dimension. Each child row gives the part of the row that this value holds.
Allocation aside
The aside on the right gives the same values in a sorted order, with up to ten entries on each card:
- Matched Groups gives the metric groups by cost. Each entry has its share and its cost for one unit. When a metric value is absent, the entry reads No NSM.
- (Dimension) Allocation appears when you set Group By. It gives the values of the dimension by cost, each with its share and its metric value.
Perspectives
Use the Perspectives button in the page action bar to save the current formula, filters, and granularity. You can apply the perspective again later.
Formulas
Open Formulas from the page action bar. Each card gives the cost expression of the formula, its breakdowns, and its base granularity. To create or edit a formula, you need the permission of an organization administrator.
The wizard has four steps.
Name
Give the formula a Name that your team knows, and an optional Description.
Cost
Cost scope decides which spend goes into the formula:
- Org-wide adds the spend of every cost pool. Select this option for one cost per unit for the whole organization.
- Specific pool(s) separates a product line, a business unit, or another part that you measure alone. Select the Pools to include.
Which cost view? decides how DigiUsher reads that cost:
| View | Cost as of |
|---|---|
| Chargeback | After the sharing between the pools. These are the costs after DigiUsher applies the redistribution rules. |
| Showback | Before the sharing between the pools. These are the costs that go on each pool directly. |
DigiUsher already computes both views, so this is a choice and not extra configuration. Use Chargeback when the number of the team must contain the shared platform cost that DigiUsher charges to it.
Metric
Select the North Star Metric to divide by. The picker lists the metrics of your organization with their unit and their update frequency. It also gives the dimensions that can divide the metric.
How often should this update? sets the base granularity: Day, Week, or Month. This is the shortest period of the computation. Later you can read the result for a wider period, but never for a shorter one. The base granularity must be equal to or wider than the update frequency of the metric.
Breakdowns (optional)
Add mappings for a cost per unit that is divided by a dimension. An example is a mapping of each data source to the team that owns it. If you skip this step, you get one cost per unit for the whole scope.
Each mapping divides the cost by one dimension on the metric side. If the metric-side dimension of a mapping does not exist on the selected North Star Metric, DigiUsher rejects the mapping here.
Mappings
A mapping pairs the cost-side data with the metric-side data. A formula can then compute the cost for one unit. Open Mappings from the page action bar.
The cost-side data is one column of your cost rows:
| Cost side | The charge's |
|---|---|
| Data source | Data source it came from |
| Region | Geographic region |
| Service name | Service or product |
The metric-side data is one of the dimensions of a North Star Metric.
There are two ways to join the two sides:
| Match type | When to use it |
|---|---|
| Lookup | The two sides use different values for the same thing, for example a data source ID on the cost side and a team name on the metric side. You pair the values in a translation table. |
| Same value | The two sides already use identical values, for example the same region code on the cost side and on the metric side. You need no translation table. |
A Lookup mapping holds Value pairs. Each pair has a cost-side value and the metric-side value that it means. A pair says: when this cost-side value appears, use that metric-side value. When the formula runs, DigiUsher puts every cost-side value that you do not list in the Unmapped group. That group appears in the result, but it has no metric. The suggestions in the pair editor come from the values in your cost data. If a value does not appear there, you can type it, and DigiUsher saves it as you type it.
The cost side, the metric side, and the match type are fixed after the creation of a mapping. You can change only the name. To change the join, delete the mapping and create a new one. You cannot delete a mapping while a formula uses it. First remove the mapping from that formula.
North Star Metrics
A North Star Metric is the business quantity that you divide the cost by. Open North Star Metrics from the page action bar, or System > North Star Metrics in the left sidebar.
The table lists each metric with its Name, Unit, Granularity, and Dimensions.
Registering a metric
Click Create NSM. This action, and every edit and delete on this page, needs the permission of an organization administrator.
| Field | Description |
|---|---|
| Name | A descriptive name for this North Star Metric, for example Daily Active Users. |
| Unit | The unit of the measurement, such as users, GB, or requests. This is free text. |
| Granularity | The frequency of the metric: Hour, Day, or Month. |
| Allowed Dimensions | The dimension keys that can divide this metric, up to five, for example customer_id and region. |
Select the dimensions with care. Group By, the mappings, and the allocation aside can divide the metric by these dimensions only. To delete a metric, you must type its exact name.
The base granularity of a formula must be equal to or wider than the granularity of its metric. A metric can have hourly values, but a formula computes for a day, a week, or a month. DigiUsher therefore adds the hourly values together, and it does not report one value for each hour.
Uploading values
The registration of a metric creates the definition only. The values come from your own systems. On the North Star Metrics page, click How to Upload to open the API reference of the upload endpoint.
Send a CSV file as multipart/form-data:
POST /api/v3/organizations/{organization_id}/metrics/nsm-values/uploadThe file must have the extension .csv, the encoding UTF-8, and a size of 1 MB or less.
DigiUsher can also fetch the CSV file. Use the URL variant with an HTTPS url query parameter:
POST /api/v3/organizations/{organization_id}/metrics/nsm-values/ingest-csv-url?url=https://example.com/nsm.csvThe file needs a header row. All four columns must be present, in any order:
| Column | Description |
|---|---|
nsm_key_name | The name of a metric that already exists in your organization |
date | ISO date (YYYY-MM-DD). DigiUsher reads it as UTC and rounds it down to the granularity of the metric |
value | The metric value. It must be positive. |
dimensions | A JSON object. Its keys must be part of the allowed dimensions of the metric, up to five. For a metric without dimensions, use an empty JSON object. |
An upload is idempotent on the combination of metric, period, and dimensions. You can therefore upload a corrected file again, and DigiUsher updates the values that exist. If two rows of one file give the same combination, DigiUsher rejects the whole file.
The upload needs a caller with the permission to manage the organization. To automate the upload, use an organization API key with that permission.