 DigiUsher Documentation
Allocation
See how cloud spend lands on your pools, before and after redistribution.
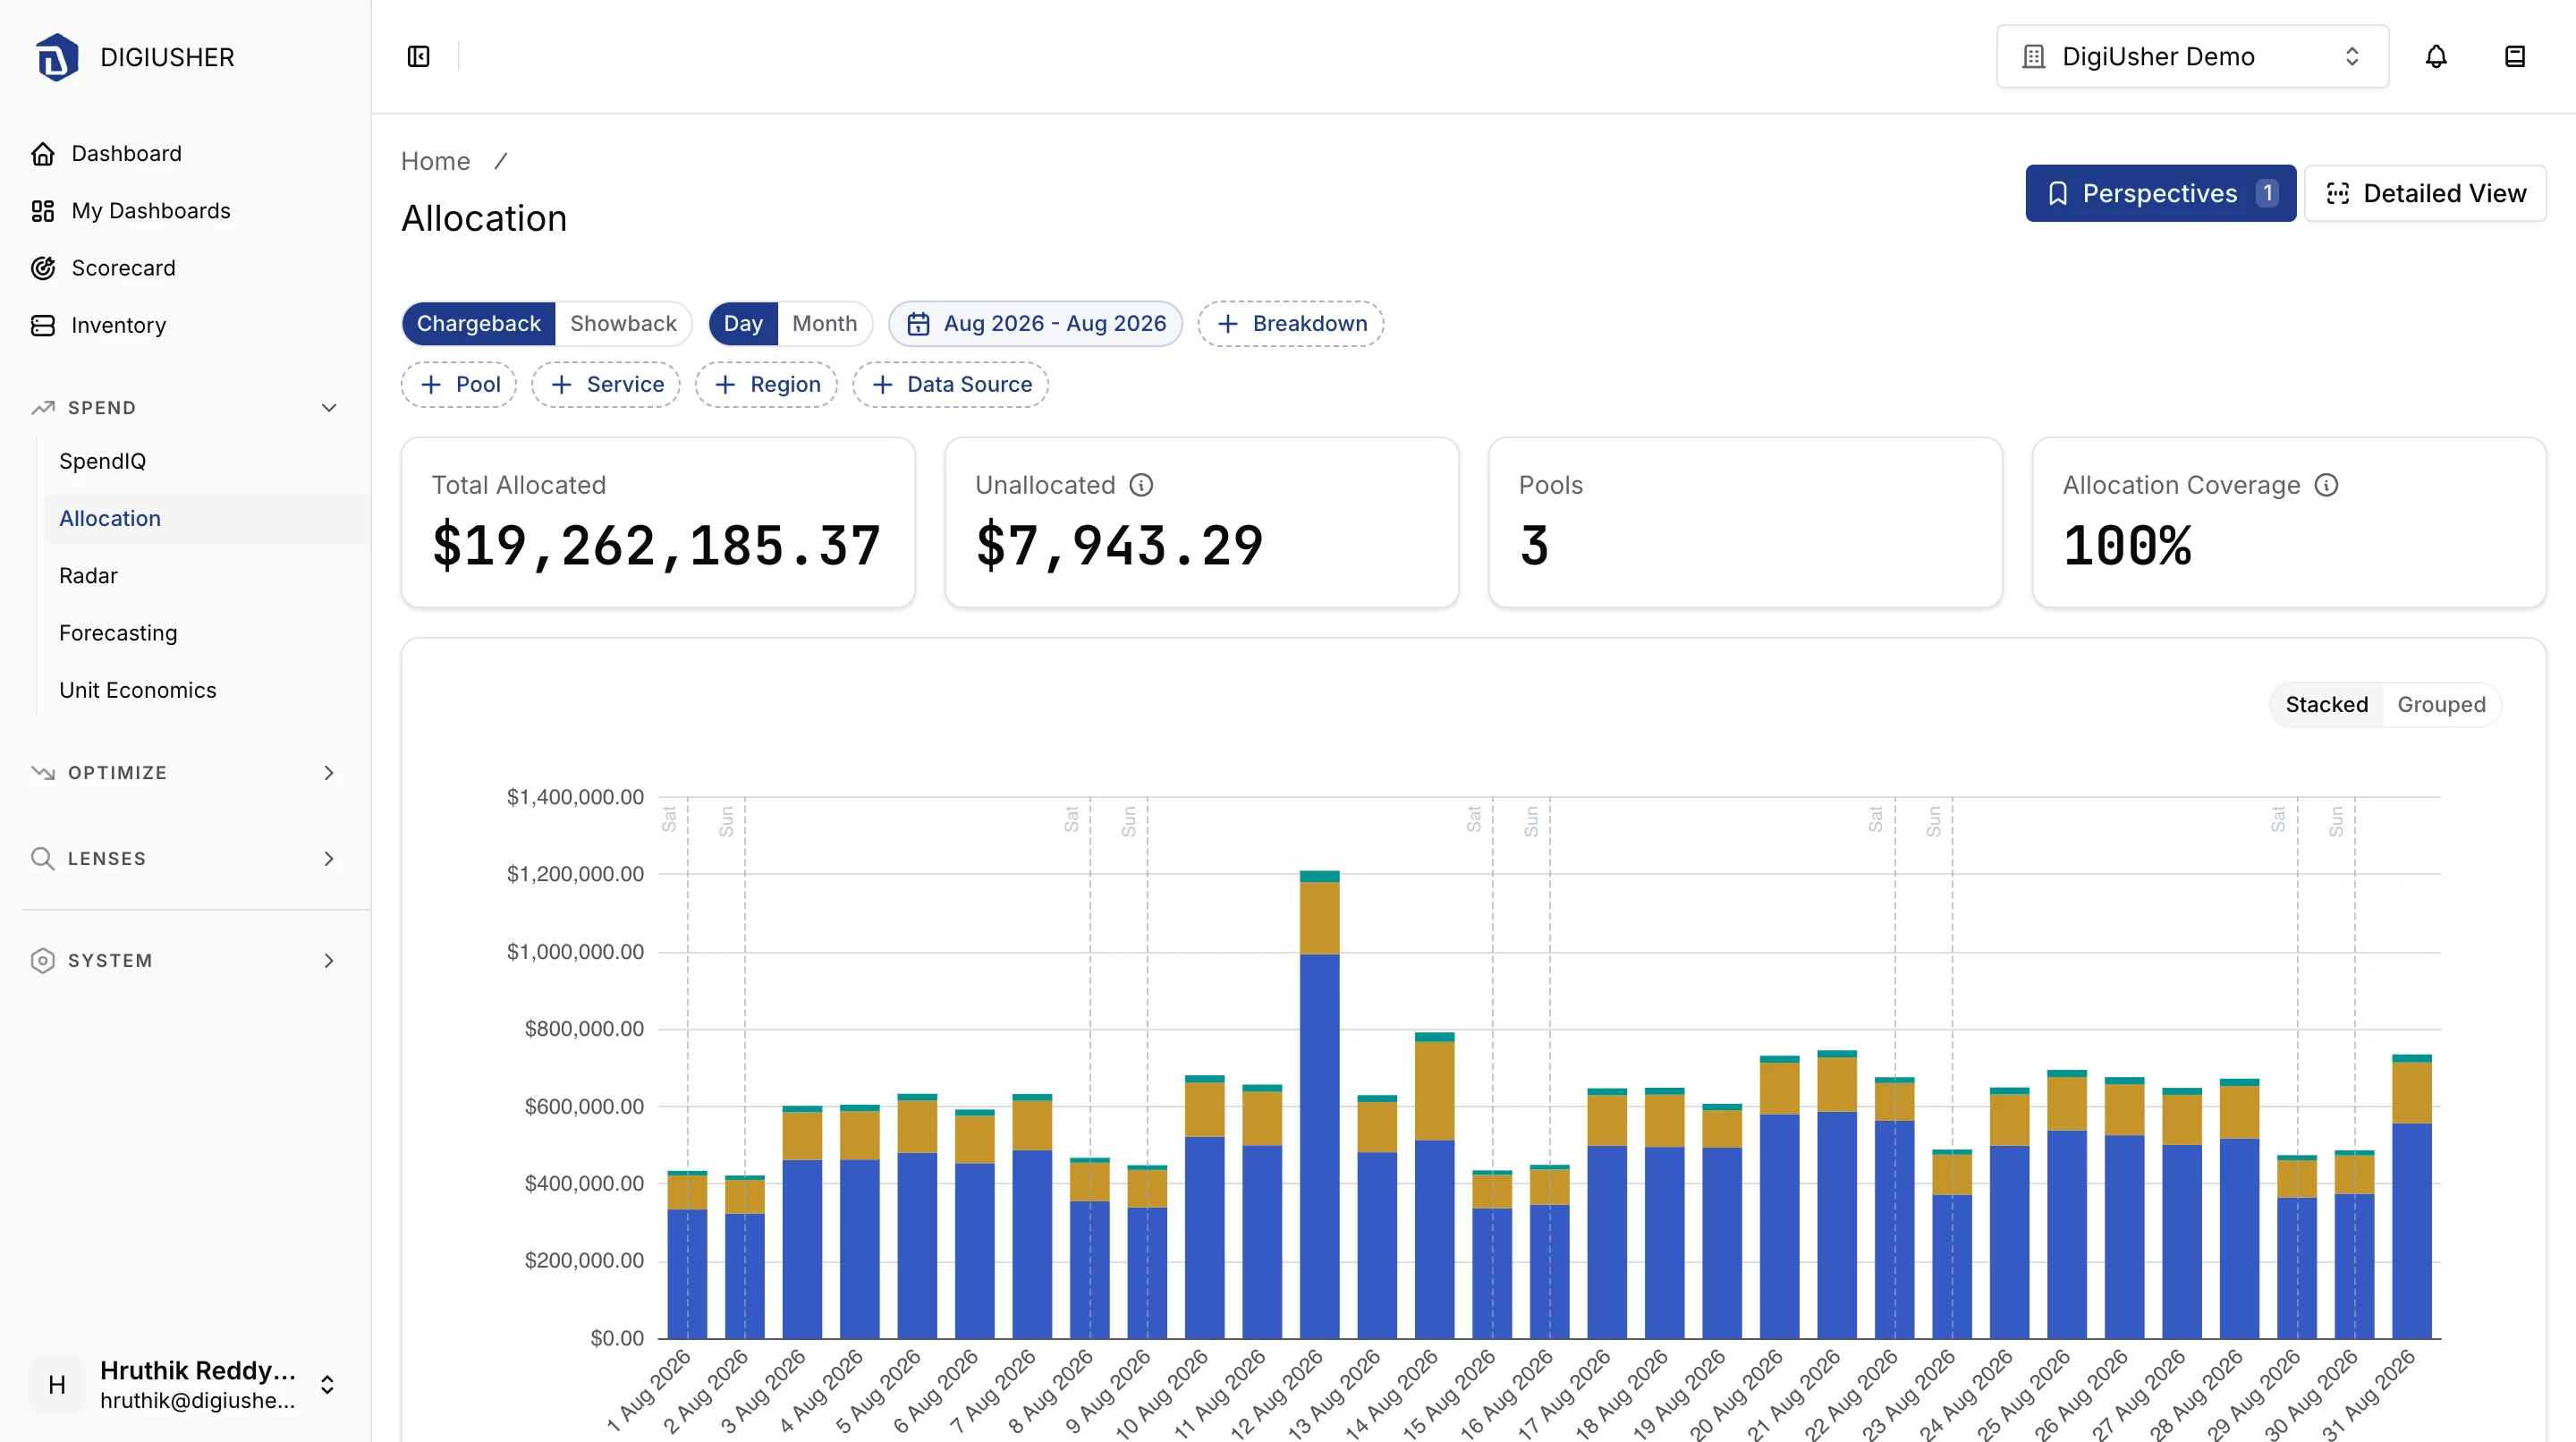
Allocation gives the cost that each pool carries in a period. You can then send finance one number for each team, product, or cost center. Open Allocation from Spend > Allocation in the left sidebar.
Use Allocation when you need to:
- Report the cost of each pool for one month or for a range of months.
- Compare the cost before the redistribution with the cost after the redistribution.
- Divide the cost of a pool by service, region, or data source.
- See how much of the bill reached a pool.
- Export the values for a chargeback report.
You configure the pools, the rules that send a cost to a pool, and the redistribution flows in the Allocation Hub. Allocation reads the result.
Chargeback and Showback
The Chargeback and Showback control selects which of the two values the page reports:
| View | What it reports |
|---|---|
| Showback | Cost of each pool before the redistribution. This is the cost that the pool spends directly. |
| Chargeback | Cost of each pool after all redistributions. This is the final charge of the pool, with the shared cost that DigiUsher moves onto it. |
Showback answers the question "What did this team run?". Chargeback answers the question "What does this team owe?", because it contains the shared platform, network, and support cost that DigiUsher charges to the team.
Filters
The controls at the top of the page apply to the cards, the chart, and the table.
| Filter | Description |
|---|---|
| Chargeback / Showback | Which of the two views the page reports. The section Chargeback and Showback gives the difference. |
| Granularity | Day or Month. Day gives one row for each day. Month gives one row for each month. |
| Month range | The months to report. |
| Breakdown | Adds Service, Data Source, or Region as an extra level of detail in the chart and the table. Select the dimensions, then apply them. |
| Pool | Limits the page to one pool from the pool hierarchy. |
| Service | Limits the page to one or more services. |
| Region | Limits the page to one or more regions. |
| Data Source | Limits the page to one or more connected data sources, with the name and the account ID of each. |
If you leave Breakdown empty, the page reports the cost of each pool only. If you add a breakdown dimension, the page divides the cost of each pool across the values of that dimension. This answers the question "What is the cost of this team made of?".
Perspectives
Use the Perspectives button in the page action bar to save the current view. A perspective holds the Chargeback or Showback selection, the granularity, the selected pool, the service, region, and data source filters, and the breakdown dimensions. You can apply a saved perspective again later. A perspective keeps a monthly report identical from one month to the next.
Summary
Four cards summarize the filtered period:
- Total Allocated gives the total cost that reached a pool. It does not contain the unallocated cost.
- Unallocated gives the cost that matched no allocation rule.
- Pools gives the number of pools that received cost in the period.
- Allocation Coverage gives the allocated cost as a percentage of the allocated cost plus the unallocated cost. Aim for 90% or more.
Coverage is the health metric to watch. When the percentage falls, new spend arrives that your allocation rules do not know yet. The cause is usually a new account, a new service, or resources without the tag that your rules read. To correct this, add a rule in the Allocation Hub or make a rule wider.
Chart
The chart plots the filtered cost over time, with one series for each pool. When a breakdown dimension is active, it draws one series for each pool and breakdown value. The chart draws the five largest series separately and combines the rest into Others. Use the Stacked and Grouped control to change between a stacked total for each period and bars side by side.
Cost Allocation Summary Table
The title of the table is Chargeback Cost Allocation Summary or Showback Cost Allocation Summary, and it follows the selected view.
| Column | Description |
|---|---|
| Pool | The pool that received the cost |
| Service / Data Source / Region | One column for each selected breakdown dimension |
| Month (or Date) | The period, in the selected granularity |
| Allocated Amount | Allocated cost of the row, added over the grouped rows |
| % of Grand Total | The part of the table total that this row holds |
| Status | Completed while the period can still change, or Finalized after the lock |
The table groups the rows by month, then by pool, then by the breakdown dimensions. It sorts by allocated amount, with the largest amount first. Open a group to see the rows in it.
Grouping Order
When more than one grouping level is active, use the Grouping Order control above the table to move a level up or down. When you group by pool first, the table answers "What is the cost of this team made of?". When you group by service first, it answers "Who pays for this service?".
Month Columns View
At the Month granularity, use the Month Columns View control and turn on Show Months as Columns. The table then gives one row for each pool and breakdown value, and one column for each month. Use this layout to see the trend of a pool over several months.
Export
To download the current view, click Export CSV above the table. For each row, the file gives the period, the pool, the active breakdown dimensions, the allocated amount, and the status.
Detailed View
Detailed View, in the page action bar, shows how the cost of one month moved from your bills to your pools. It uses one month, and not a range. Select the month with the month picker.
Summary
- Completed On gives the time when the allocation run of the month completed.
- Status gives Completed or Finalized.
- Period gives the month that the page explains.
- Pools gives the number of pools with a value in the run.
Cost Allocation Flow
The Cost Allocation Flow card shows the allocation of the month as a series of stages. It has two tabs:
- Flow is a flow diagram. It shows the cost that moves from its source, through the matched rules, into the pools, and then between the pools during the redistribution. The width of each link is proportional to the amount.
- Stepped Tree shows the same stages as a tree. This tab is easier to read when one stage has many targets.
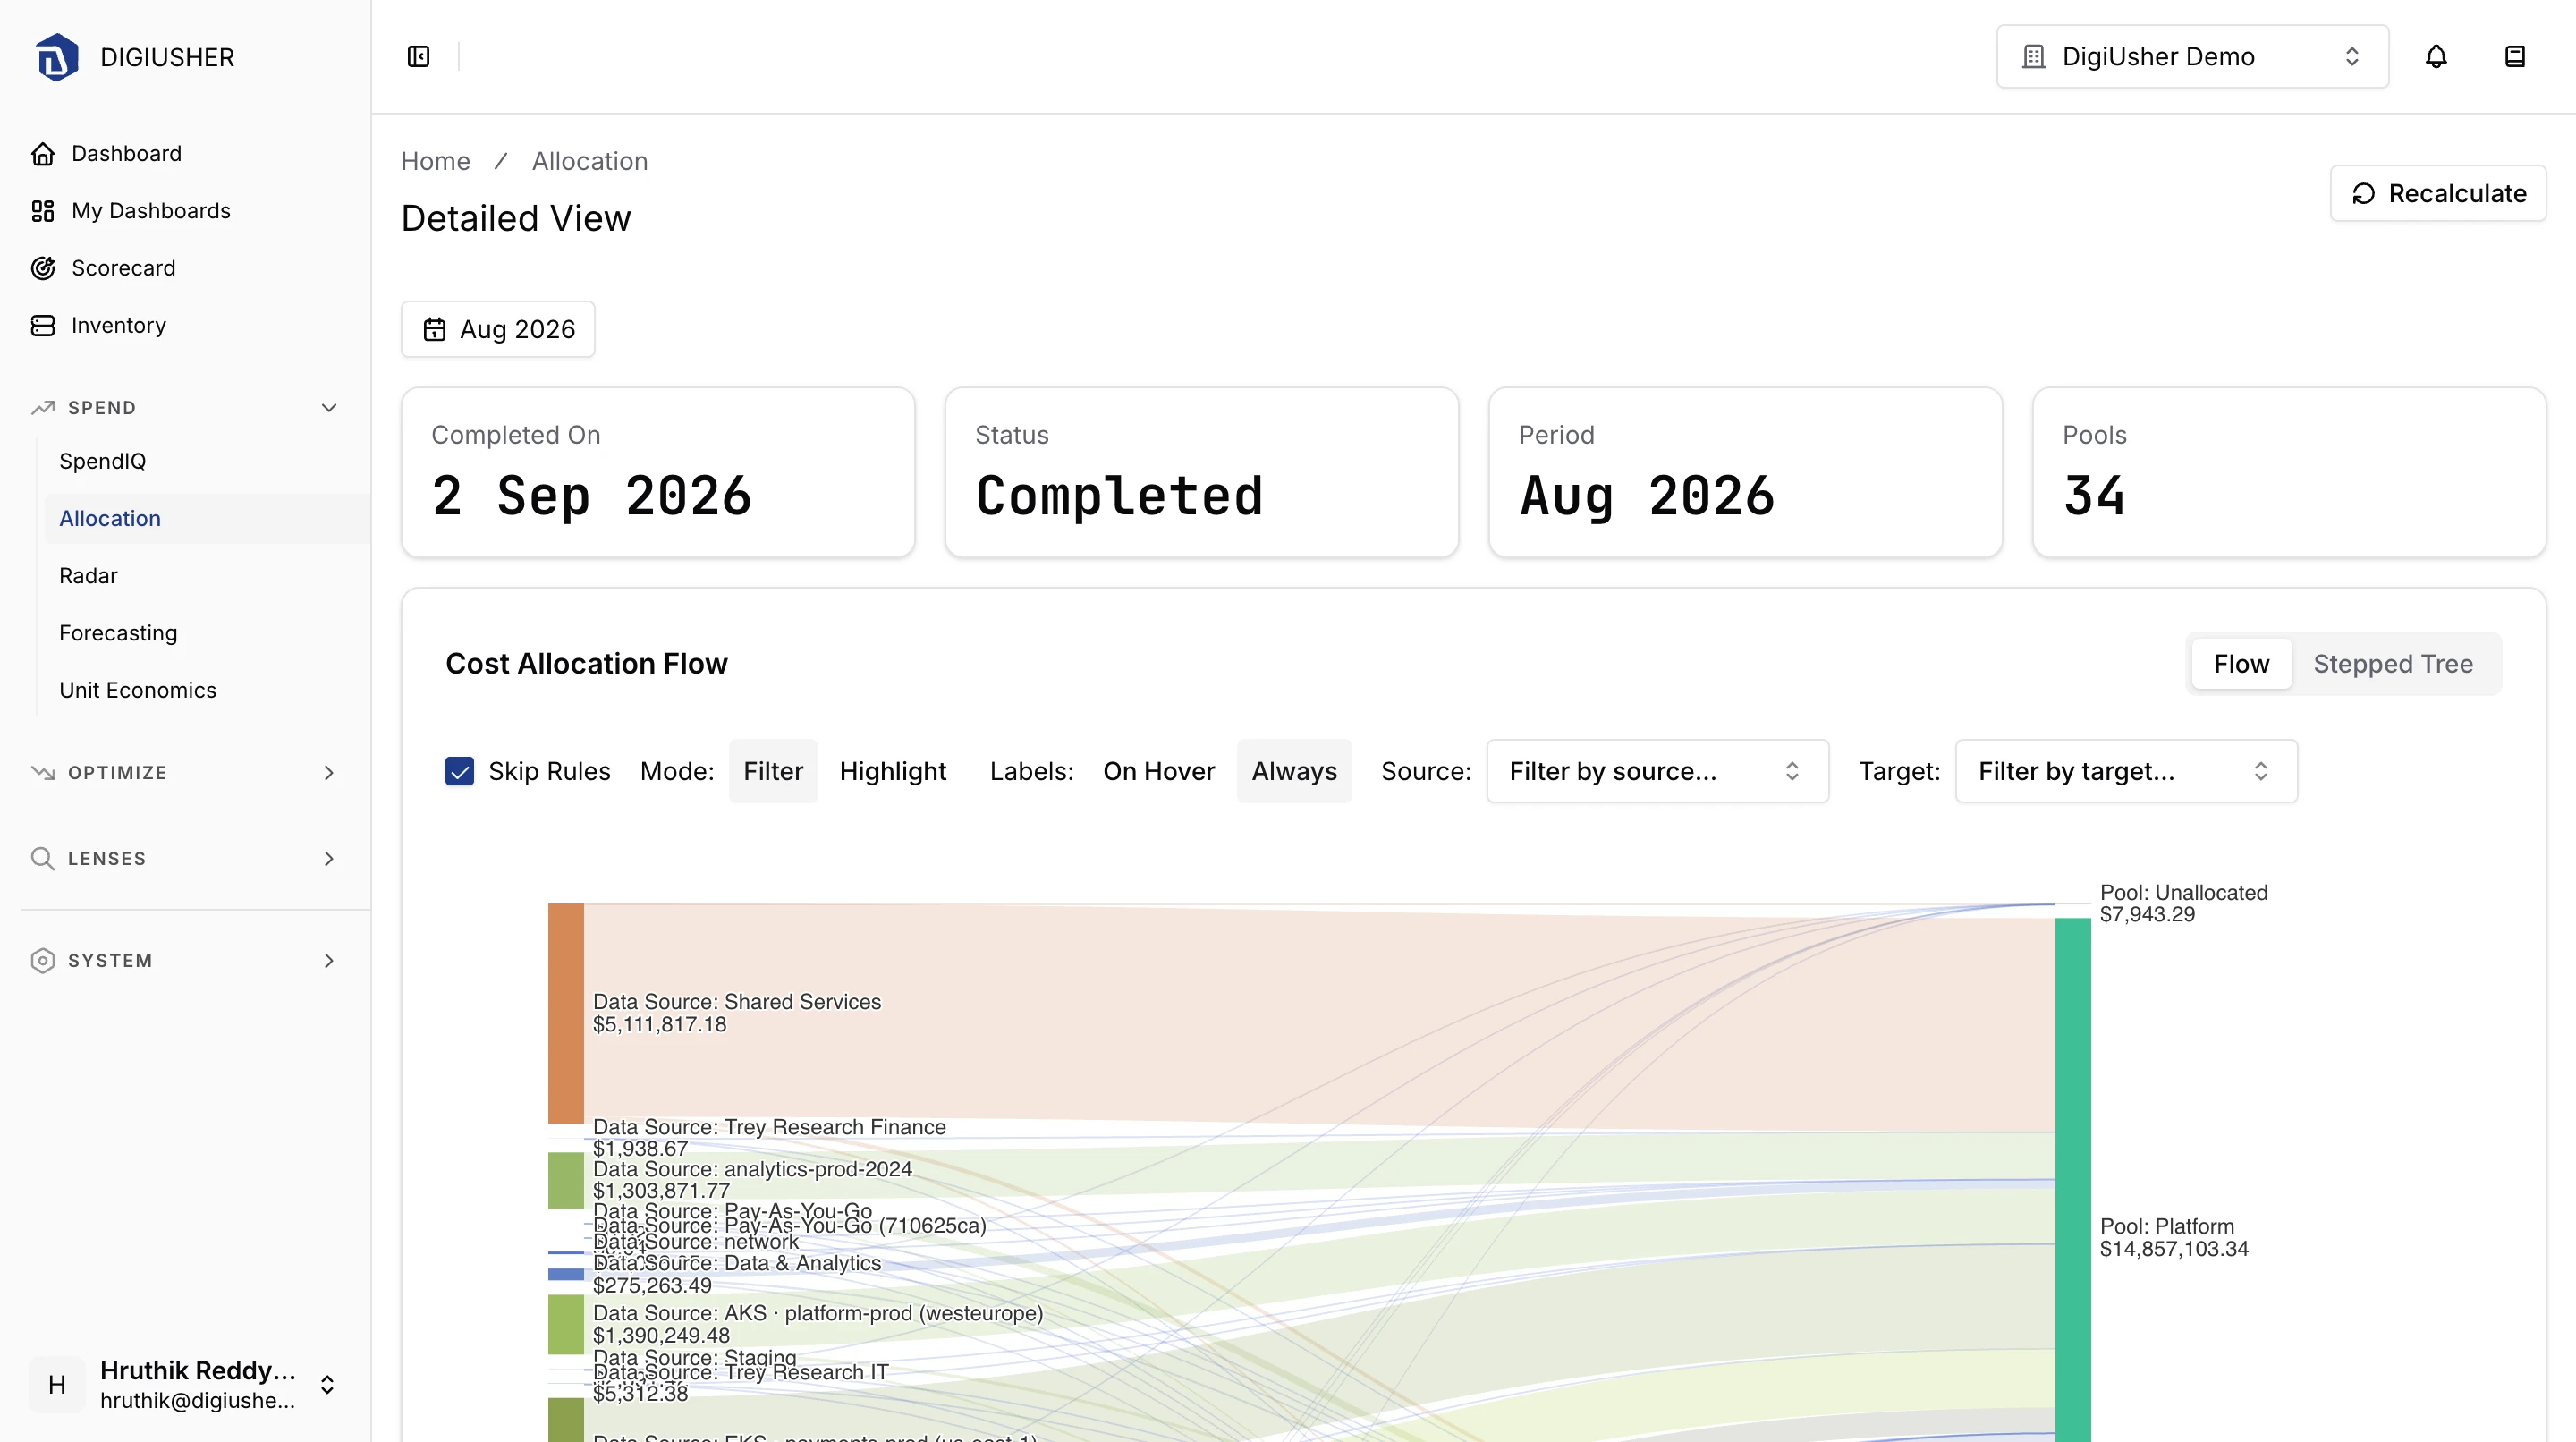
These two views answer the question "Why does this pool have this number?". Each stage gives the amount that entered it and the amount that left it.
Recalculate
Recalculate computes the chargeback pipeline of the selected month again. Use it after you correct the allocation configuration and you need the values of the month immediately. If you do not use it, the next scheduled run rebuilds the values.
A recalculation takes several minutes, and the results do not appear immediately. Between two recalculations of the same organization there is a cooldown of 15 minutes.
CAUTION: Do not recalculate a Finalized month without a reason. The recalculation removes the finalized state, and the locked data becomes changeable again. In the confirmation dialog, you must type recalculate to continue.
Only an administrator of the organization can use Recalculate.